- Panyu District, Guangzhou, Guangdong, China
- 2044, 2nd Floor, Yayun Avenue, Dalong Street
- whatsapp:
- +86 13265357928
How to Quickly Identify Hidden Correlations Between Test Items Using the SPC System?
In an SPC system, there is a significant amount of test data stored, and there might be correlations between test items from common sources. Generally, we organize this test data, use Minitab or Excel, and perform correlation and regression analyses in pairs, adjusting the lag period to find the optimal leading influence.
If the test dates of the items cannot be perfectly aligned (for instance, if they differ by a few seconds but belong to the same batch/time), it becomes even more complicated.
This process is cumbersome, requiring data organization before analyzing with tools, and each lag period needs analysis to find or fail to find a pattern.
Let’s see how our SPC product handles this.
Features
- Can create scatter plots and perform regression analysis for any two test items.
- Offers various options to align test dates.
- Allows the lag period to be a range, making it easier to find the leading influence without trying each period one by one.
- Can complete all these tasks within one system with just a few clicks, without the need to organize data into Excel, Minitab, or other analysis tools.
Next, let's look at the specific operations:
Select the test Items to Analyze
We select the test items from the list that need correlation analysis (requiring single values).
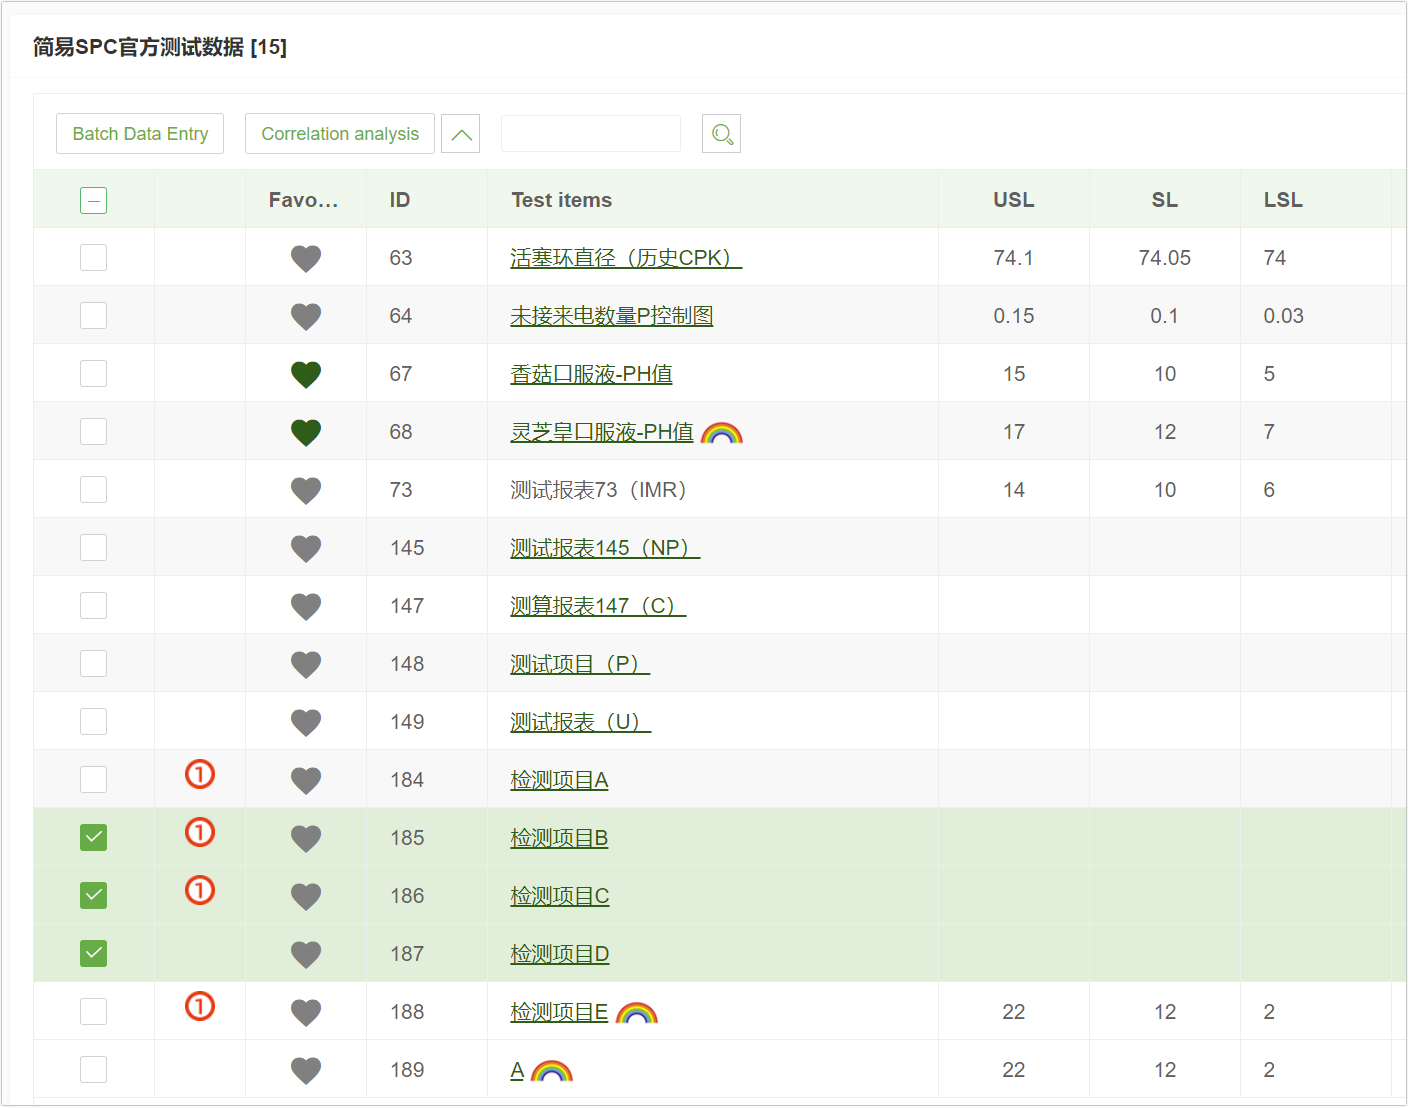
Click the correlation analysis button to open the following page:
Set Parameters
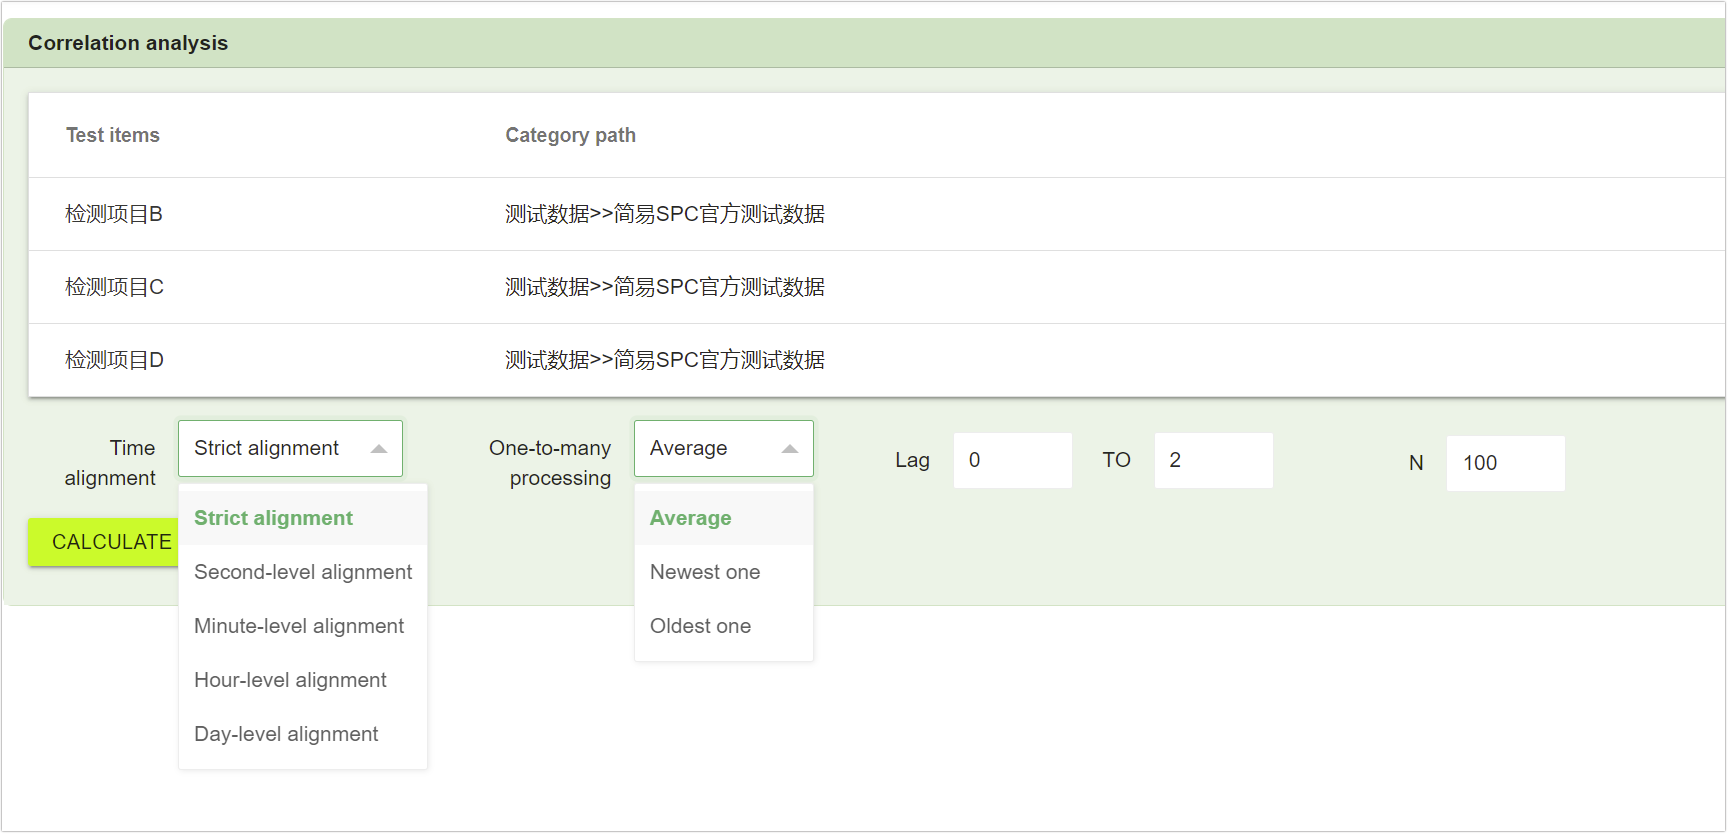
- Confirm that the test items have records.
- Choose the time alignment method, as the actual time values of the same batch/time point for the two test items may differ by milliseconds/seconds, so different alignment methods can be chosen.
- One-to-Many Handling: If aligned data results in one test item corresponding to multiple entries of another item (i.e., one x corresponds to multiple y), we need to choose how to handle this. Options include taking the average value, the latest entry, or the oldest entry.
- Lag: Lag 0 means analyzing the current period's influence. A lag of -2 means the influence of test item 1's current period on test item 2's two periods ahead, which can also be seen as the leading influence on test item 2.
- N: The number of aligned records might be numerous; the latest N records can be extracted for analysis.
Analysis Results
We fill in the lag period from 0 to 2 to see the correlation of different lag periods.
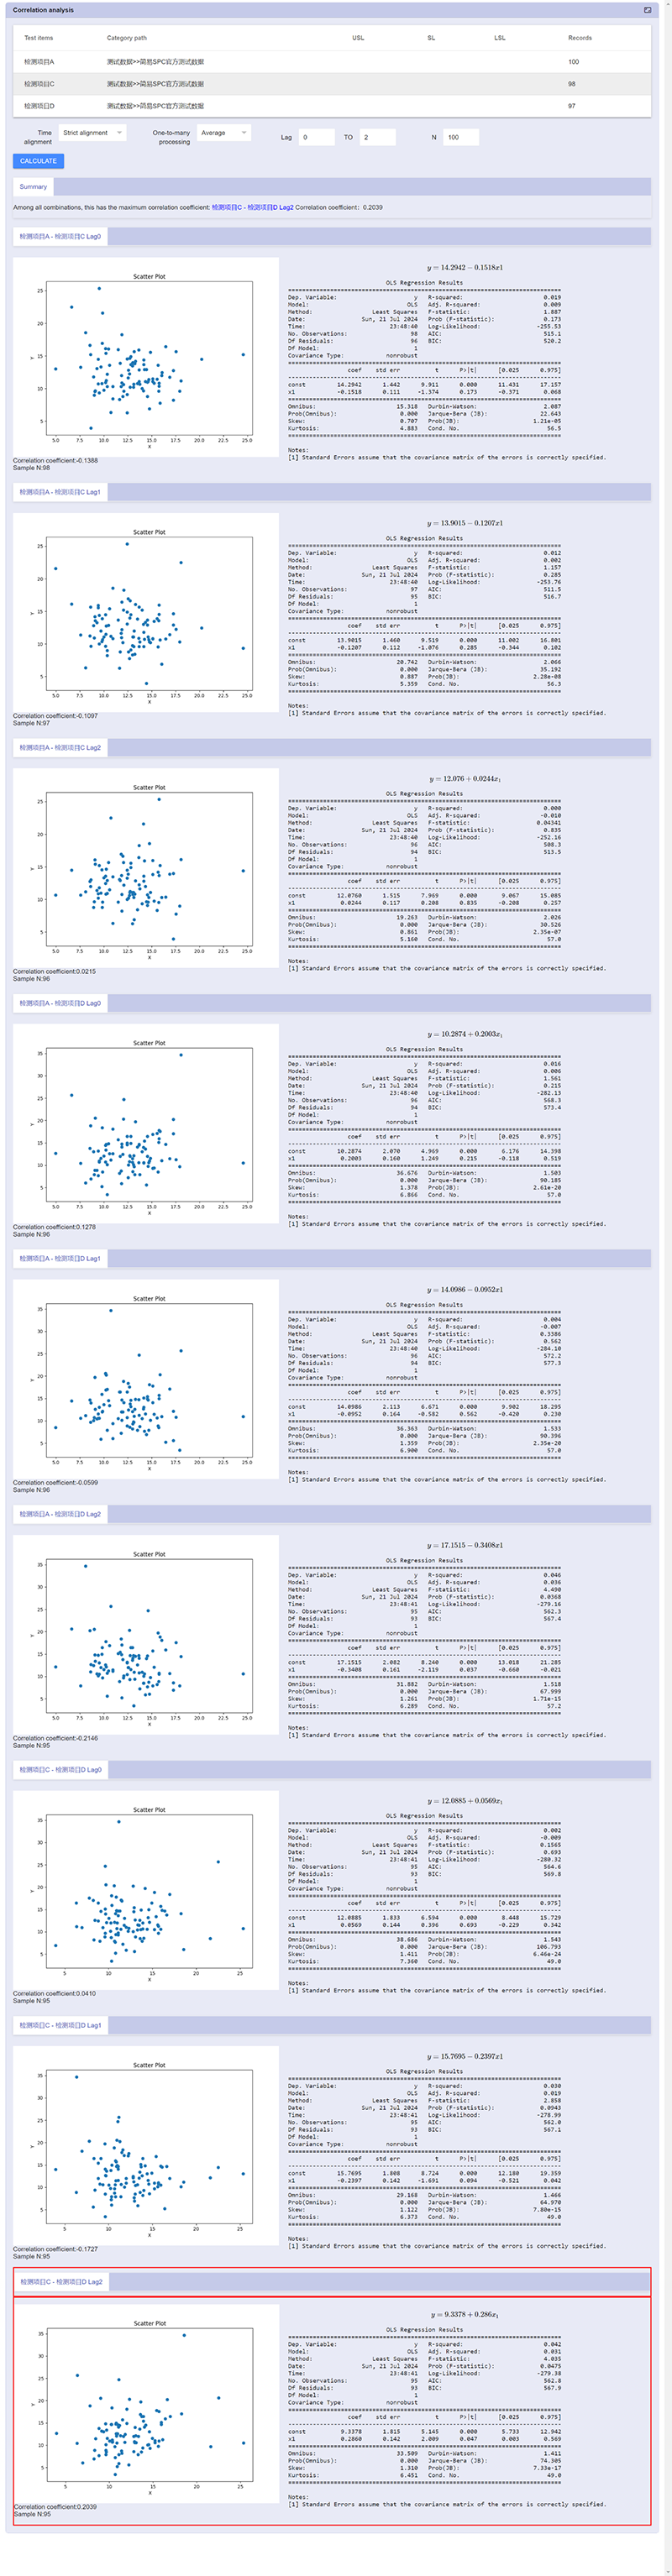
From the scatter plots and regression analyses of lag 0 to 2, it is evident that the correlation is more significant with a lag of 2 of test item C and test item D. This means that the N-2 period of test item 1 has a noticeable influence on the N period of test item 2.
We all know the theory is well understood and highly useful, but without a good tool, it is challenging to apply. Our product is such a tool.
- What If Subgroup Sizes Are Not Fixed?
- Invisible Variations That Define Yield :Practical Applications of SPC in Semiconductor Manufacturing
- Simple SPC 4.0 – Detailed Product Overview
- Simple SPC 4.0 Official Release
- Using data to safeguard safety: Application practices of SPC in the pharmaceutical industry
- How can risks be identified in advance in automobile manufacturing? — Sharing SPC application practices
- Innovative Practices and Applications of Web SPC Systems
- Should Manufacturing Companies Still Implement SPC Amid Economic Downturn and Poor Business Performance?
- What should we do if the customer requires the immediate implementation of SPC process control during a factory audit?
- Simple SPC has been recognized for the third time as the "2025 SPC Statistical Process Control Software of the Year" by China SoftWare Home.
- Giving SPC AI Wings: DeepSeek Enhancing Efficiency and Depth of Quality Management
- AI-Enhanced Statistical Process Control (AI-SPC): Revolutionizing Quality Management in the Era of Smart Manufacturing
- General-Purpose Artificial Intelligence Models (DeepSeek, etc.) and Statistical Process Control (SPC): A New Era of Intelligent Quality Management
- Simple SPC 2.0 released, with upgraded functions and optimized performance
- CPK and PPK: Essential Questions in Quality Interviews, Do You Truly Understand Them?
- Unilateral or Bilateral: An In-Depth Exploration of Specification Limits and Control Limits in SPC Analysis and Their Impact on Metrics
- How to Calculate Control Limits for Xbar-R and Xbar-S Control Charts in SPC Analysis and When to Use Each Chart
- Is SPC or Another Method Better for Determining Batch Consistency with Standards? A Recommended Analysis Approach
- Beyond SPC Control Charts: Lesser-Known but Effective Quality Analysis Tools
- SPC is the most accessible, effective, and performance-demonstrating analytical tool in the manufacturing industry.