- Panyu District, Guangzhou, Guangdong, China
- 2044, 2nd Floor, Yayun Avenue, Dalong Street
- whatsapp:
- +86 13265357928
Is SPC or Another Method Better for Determining Batch Consistency with Standards? A Recommended Analysis Approach
Let's say we have a batch of 3000 pieces, with each piece required to weigh 200g ± 5g. Based on previous experience, the pass rate is about 98%. Using this pass rate, we estimate that we need to sample 60 pieces. For this example, let's assume we sample 100 pieces.
We have sampled 100 pieces and measured their weights, resulting in 100 data points. How can we determine if the weights of this batch are consistent with our standard of 200g?
The data is as follows:
201.67, 202.33, 196.55, 197.94, 199.76, 195.77, 198.74, 199.81, 197.87, 198.49, 198.32, 199.14, 197.74, 200.36, 199.34, 197.67, 200.29, 200.98, 200.75, 202.73, 200.11, 201.47, 200.47, 201.23, 201.76, 204.01, 203, 200.3, 201.34, 197.02, 198.01, 196.63, 200.96, 201.84, 199.06, 201.19, 196.05, 198.24, 198.34, 201.16, 199, 199.12, 202.25, 200.77, 198.83, 201, 200.1, 199.7, 199.93, 199.86, 202.2, 198.8, 201.31, 200.96, 199.83, 202.44, 198.76, 197.26, 197.17, 201.26, 200.59, 197.6, 201.03, 203.05, 199.63, 197.48, 200.34, 200.42, 197.59, 198.16, 197.9, 198.05, 199.36, 202.68, 198.53, 201.11, 197.29, 200.38, 200.02, 201.64, 199.89, 199.5, 195.33, 203.19, 199.45, 199.66, 202.58, 201.08, 198.01, 199.08, 200.82, 197.92, 199.55, 198.81, 201.74, 201.54, 199.58, 198.09, 197.81, 201.56
SPC Analysis
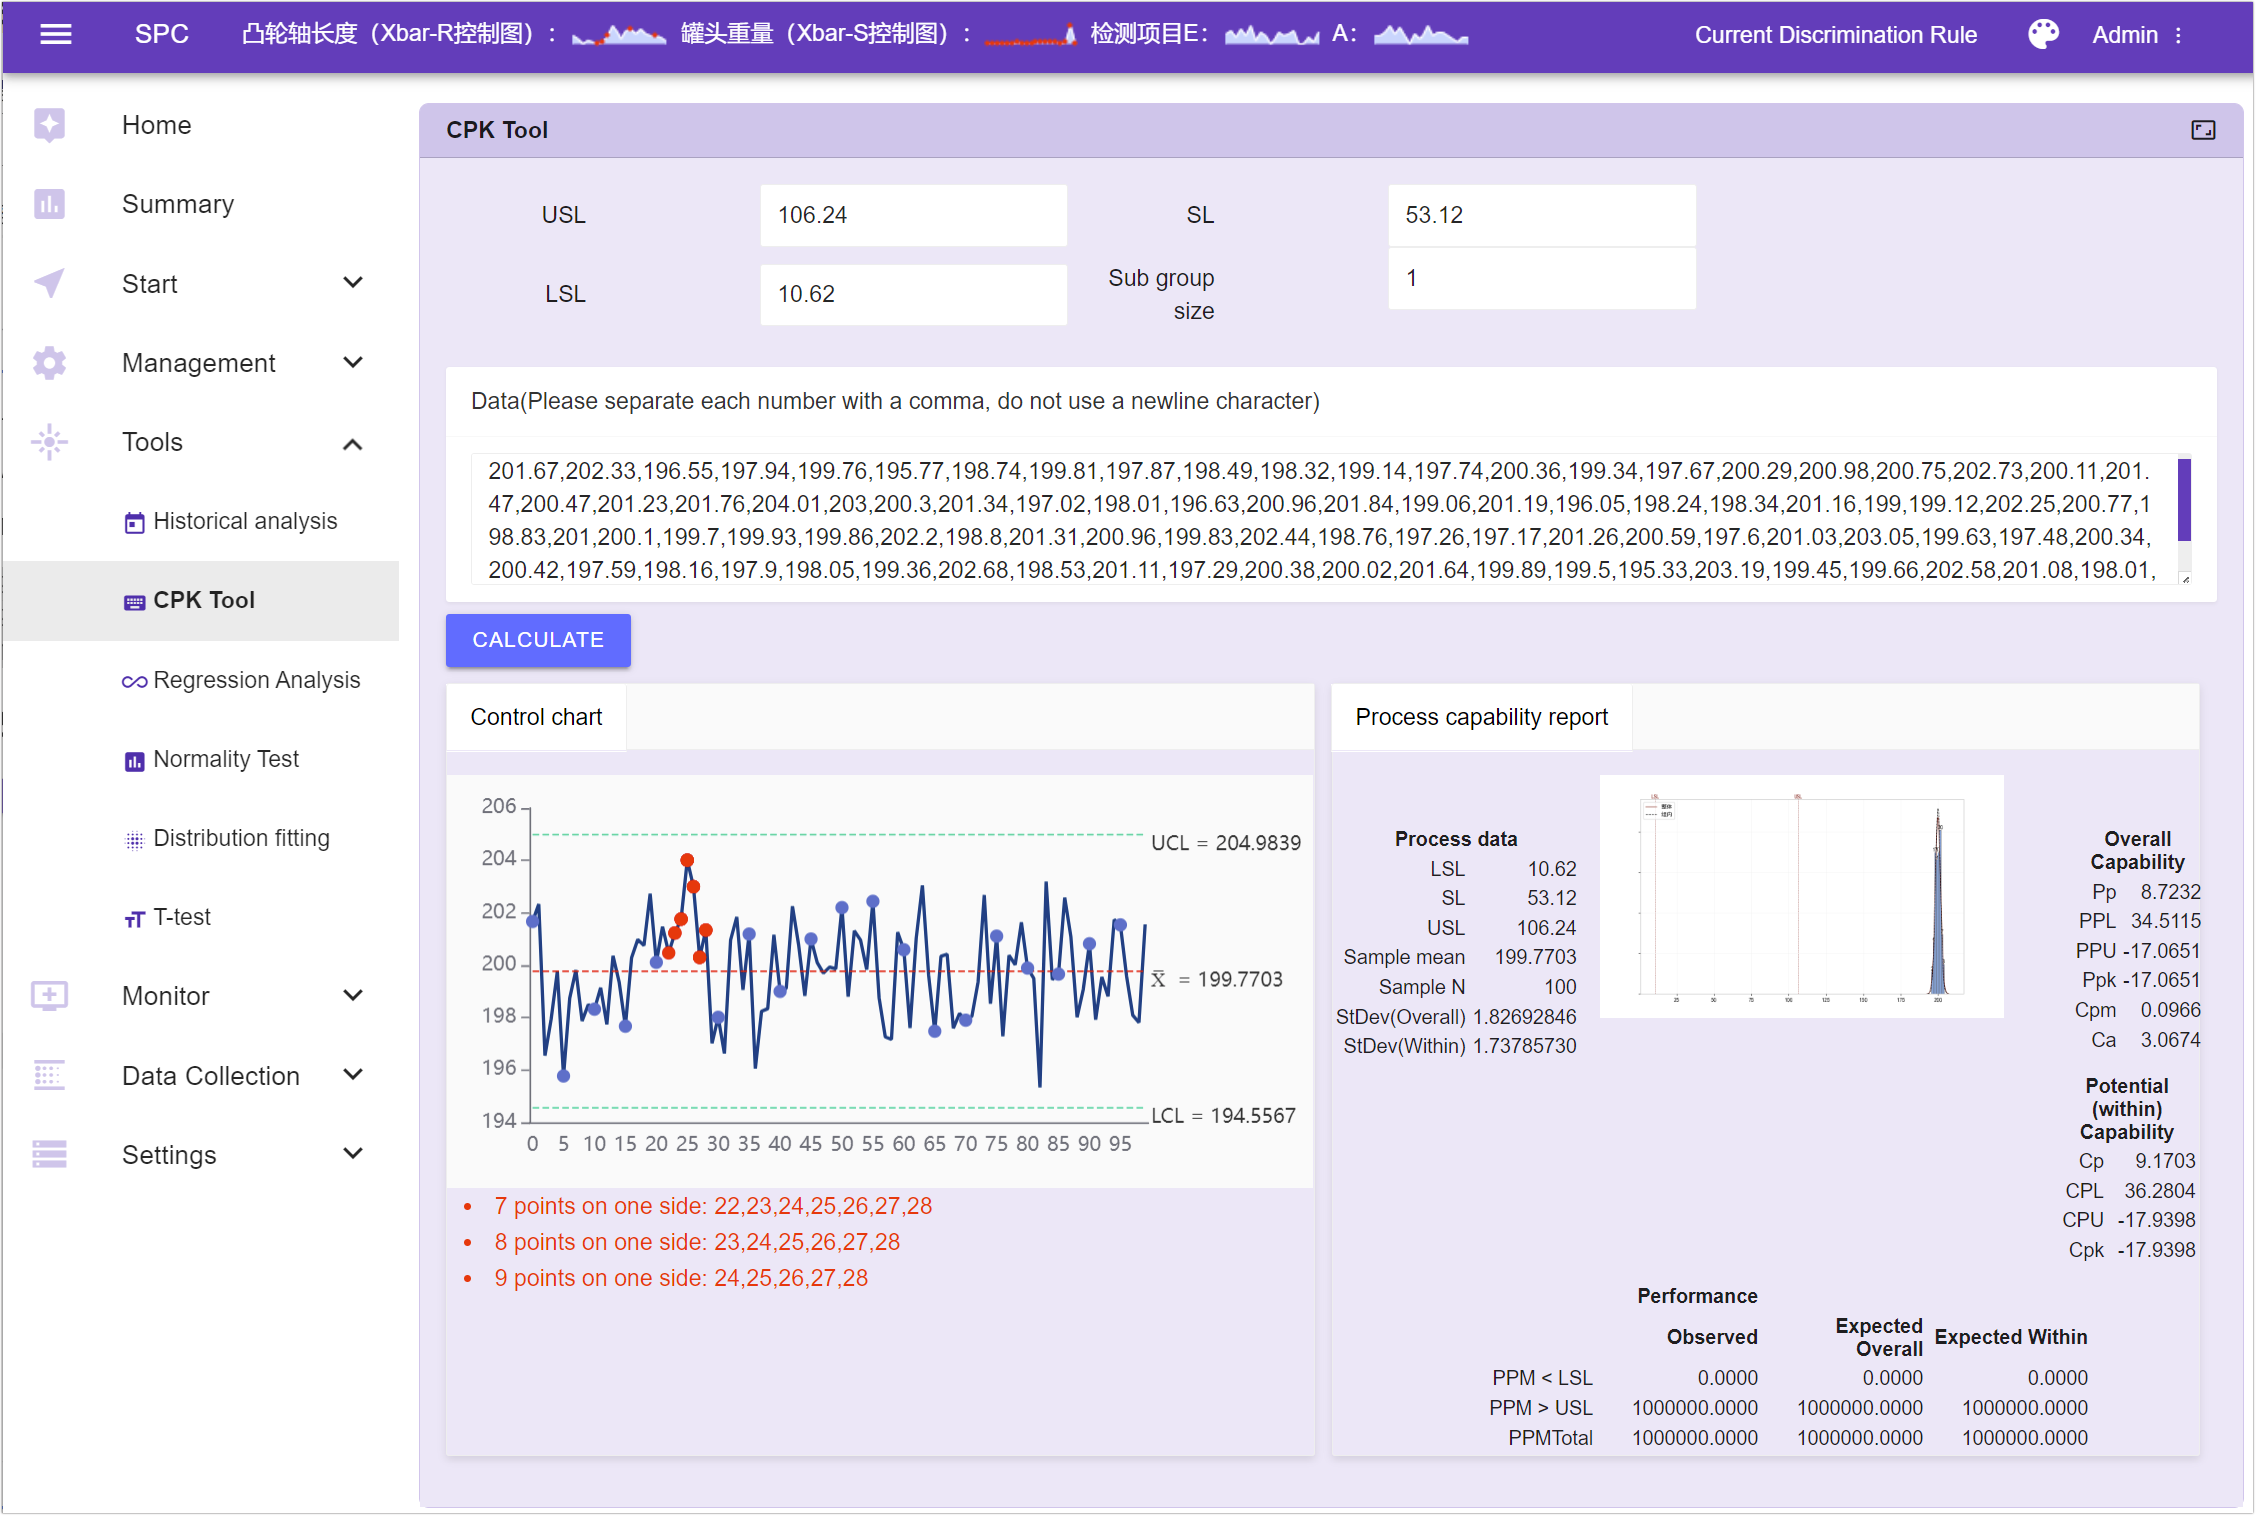
If we use SPC (Statistical Process Control) analysis, we encounter the following issues:
- Mean Value: The mean of the data is 199.77, very close to 200. But how do we determine if this is consistent? What defines "close"?
- Control Limits: The data does not exceed the upper and lower three-sigma limits, but these limits are calculated based on the sample's mean and standard deviation, not the specification center.
- Capability Index (Ca): The Ca value is -0.04, indicating the data is close to the specification center, but it doesn't define what is considered "close."
SPC analysis is typically based on time order, and in this case, the sequence of samples affects the control chart analysis and judgment. Therefore, if we cannot determine the order of the sampled items, using SPC control charts might lead to inaccurate conclusions.
Recommended Method: One-Sample T-Test
Instead of SPC, we should use a one-sample T-test. This test can determine if the sample mean is significantly different from the target value. The null hypothesis of the test is that the sample mean is equal to the target value (200g), and the alternative hypothesis is that the sample mean is not equal to the target value.
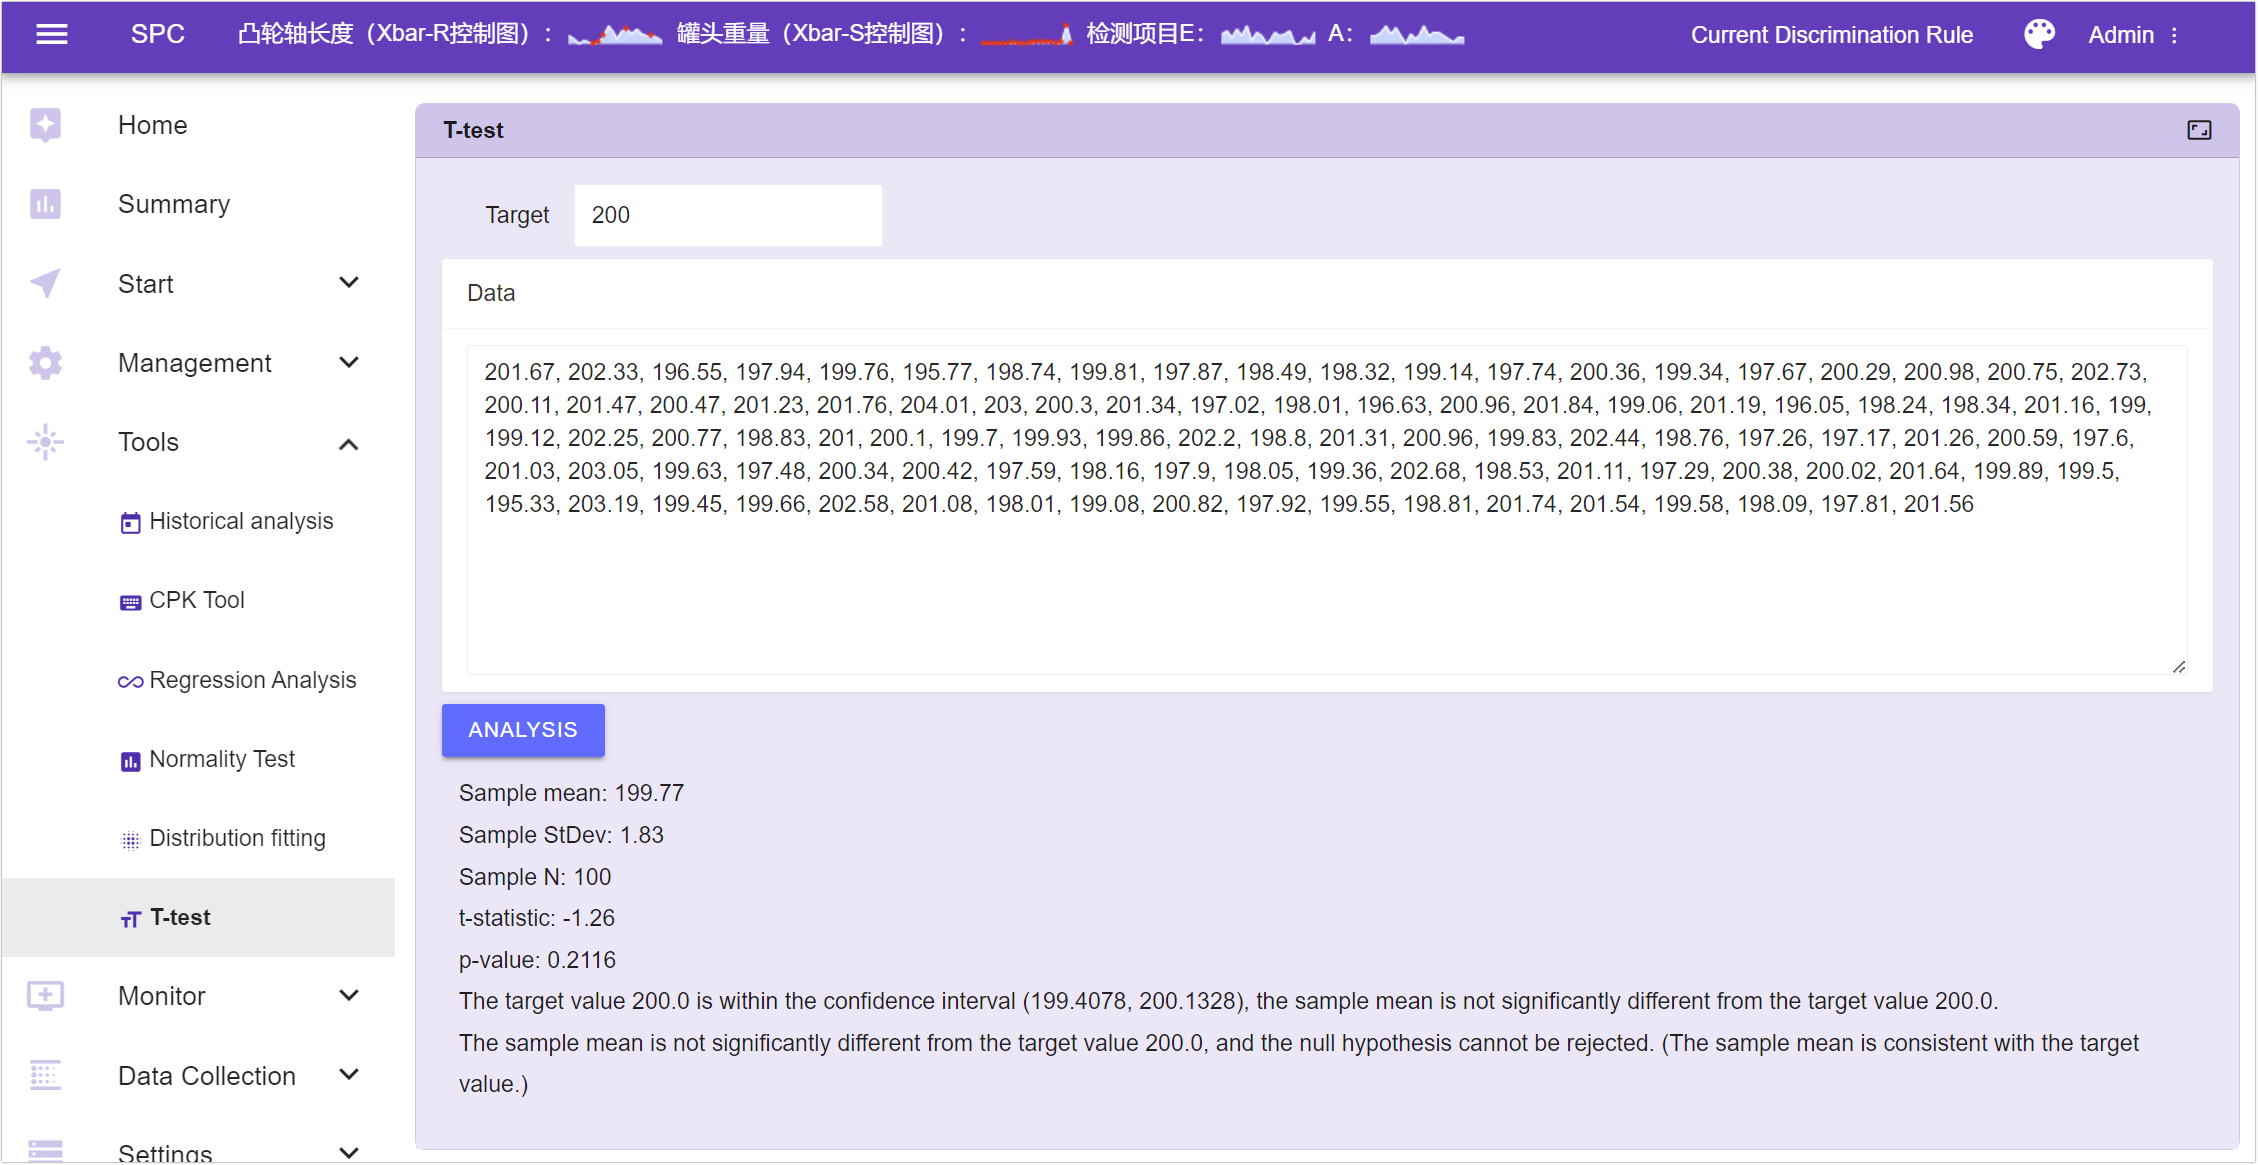
Results:
- Sample Mean: 199.77
- Sample Standard Deviation: 1.83
- Sample Size: 100
- T-Statistic: -1.26
- P-Value: 0.2116
The target value of 200.0 is within the confidence interval (199.4078, 200.1328), indicating no significant difference between the sample mean and the target value of 200.0.
The sample mean does not significantly differ from the target value of 200.0, so we cannot reject the null hypothesis (the sample mean is consistent with the target value).
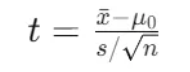
The T-Test Calculation Process
Suppose we want to test a sample mean ![]() , sample standard deviation ( s ), and sample size ( n ) against a target mean ( μ ) of 200g. The t-value can be calculated using the following formula:
, sample standard deviation ( s ), and sample size ( n ) against a target mean ( μ ) of 200g. The t-value can be calculated using the following formula:
Confidence Interval Formula:
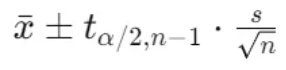
where ![]() is the critical value from the t-distribution with n-1 degrees of freedom.
is the critical value from the t-distribution with n-1 degrees of freedom.
T-Statistic and P-Value:
- If the p-value is less than the significance level (e.g., 0.05), reject the null hypothesis, indicating the sample mean is significantly different from 200g.
- If the p-value is greater than the significance level, fail to reject the null hypothesis, indicating no significant difference between the sample mean and 200g.
Confidence Interval:
- If 200g is within the confidence interval, it indicates no significant difference between the sample mean and 200g.
- If 200g is outside the confidence interval, it indicates a significant difference between the sample mean and 200g.
Using both the t-statistic/p-value and the confidence interval, we can determine if the sample weight is consistent with the target value of 200g.
Conclusion
SPC is not suitable for determining if a sample is consistent with the specification center; it is a tool for anomaly analysis. For determining if a sample is consistent with the specification center, the recommended method is the one-sample T-test.
- What If Subgroup Sizes Are Not Fixed?
- Invisible Variations That Define Yield :Practical Applications of SPC in Semiconductor Manufacturing
- Simple SPC 4.0 – Detailed Product Overview
- Simple SPC 4.0 Official Release
- Using data to safeguard safety: Application practices of SPC in the pharmaceutical industry
- How can risks be identified in advance in automobile manufacturing? — Sharing SPC application practices
- Innovative Practices and Applications of Web SPC Systems
- Should Manufacturing Companies Still Implement SPC Amid Economic Downturn and Poor Business Performance?
- What should we do if the customer requires the immediate implementation of SPC process control during a factory audit?
- Simple SPC has been recognized for the third time as the "2025 SPC Statistical Process Control Software of the Year" by China SoftWare Home.
- Giving SPC AI Wings: DeepSeek Enhancing Efficiency and Depth of Quality Management
- AI-Enhanced Statistical Process Control (AI-SPC): Revolutionizing Quality Management in the Era of Smart Manufacturing
- General-Purpose Artificial Intelligence Models (DeepSeek, etc.) and Statistical Process Control (SPC): A New Era of Intelligent Quality Management
- Simple SPC 2.0 released, with upgraded functions and optimized performance
- CPK and PPK: Essential Questions in Quality Interviews, Do You Truly Understand Them?
- Unilateral or Bilateral: An In-Depth Exploration of Specification Limits and Control Limits in SPC Analysis and Their Impact on Metrics
- How to Calculate Control Limits for Xbar-R and Xbar-S Control Charts in SPC Analysis and When to Use Each Chart
- Beyond SPC Control Charts: Lesser-Known but Effective Quality Analysis Tools
- SPC is the most accessible, effective, and performance-demonstrating analytical tool in the manufacturing industry.
- How to Quickly Identify Hidden Correlations Between Test Items Using the SPC System?