CPK and PPK: Essential Questions in Quality Interviews, Do You Truly Understand Them?
In the realm of quality management, CPK (Process Capability Index) and PPK (Process Performance Index) are common interview questions and indispensable statistical indicators for quality professionals. They seem simple, yet often lead to confusion and debate.
Basic Definitions and Differences between CPK and PPK

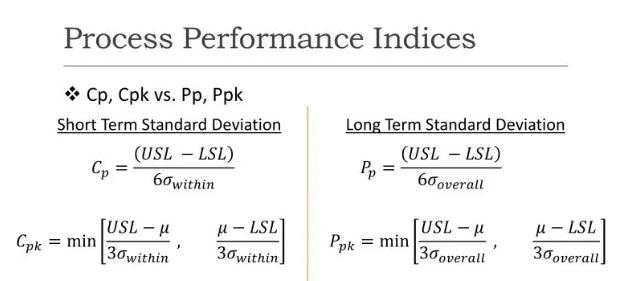
CPK: Process Capability Index, reflects the capability of a process under controlled conditions, typically used to measure short-term process capability. PPK: Process Performance Index, reflects the actual performance of a process, typically used to measure long-term process capability. The calculation formulas for both are similar, but the estimation method for σ (standard deviation) differs: CPK: Uses within-subgroup standard deviation to estimate σ; the calculation method for within-subgroup standard deviation varies for different data types. PPK: Considers overall variation and uses overall standard deviation to estimate σ. CPK might overestimate process capability, while PPK is closer to the true capability.
Application Scenarios of CPK and PPK
CPK Calculation: Based on control charts (x̄-R chart or x̄-s chart), σ is calculated using the average range (R-bar) divided by d2, or the average sample standard deviation (S-bar) divided by c4. PPK Calculation: Includes all data within the control chart in the calculation, σ is calculated directly using the STDEV() function in Excel. Cpk reflects within-subgroup variation (short-term fluctuation), while Ppk includes both short-term within-subgroup variation and long-term between-subgroup variation, representing the overall quality indicator of the entire production process. In practical applications, some advocate using Ppk for control during new product trial production and switching to Cpk for control after mass production stabilizes. This is because the quality fluctuation is large during the trial production stage, and Cpk might not be effective for control; only Ppk can provide an understanding of the overall quality.
Doubts and Reflections: Are CPK/PPK Just a "Numbers Game"?
However, some people question the value of CPK and PPK. Some believe that Ppk has limited practicality because calculating overall quality means the product has already been produced, and it's impossible to prevent defective products in real-time. Moreover, the data might not come from actual measurements but rather be "fabricated." CPK and PPK seem to have become a "numbers game." Furthermore, there's also debate about whether CPK and PPK represent short-term or long-term capability. Some point out that short-term/long-term capability has nothing to do with CPK/PPK but is solely related to sampling. Short sampling time means short-term capability, and vice versa.
How to View CPK, PPK, and Sampling?
CPK and PPK, as important process capability indicators, play a significant role in quality management. However, we should also recognize their limitations and not blindly pursue indicators while neglecting the control and improvement of the actual process. Sampling plays a crucial role in quality management. The sampling method and sample size will both affect the assessment of process capability. Therefore, when using CPK and PPK, we need to pay attention to the rationality and representativeness of sampling.
CPK, PPK, and sampling are all very important tools in quality management. We need to deeply understand their connotations and limitations and apply them flexibly to truly realize their value and achieve effective quality control.
- What If Subgroup Sizes Are Not Fixed?
- Invisible Variations That Define Yield :Practical Applications of SPC in Semiconductor Manufacturing
- Simple SPC 4.0 – Detailed Product Overview
- Simple SPC 4.0 Official Release
- Using data to safeguard safety: Application practices of SPC in the pharmaceutical industry
- How can risks be identified in advance in automobile manufacturing? — Sharing SPC application practices
- Innovative Practices and Applications of Web SPC Systems
- Should Manufacturing Companies Still Implement SPC Amid Economic Downturn and Poor Business Performance?
- What should we do if the customer requires the immediate implementation of SPC process control during a factory audit?
- Simple SPC has been recognized for the third time as the "2025 SPC Statistical Process Control Software of the Year" by China SoftWare Home.
- Giving SPC AI Wings: DeepSeek Enhancing Efficiency and Depth of Quality Management
- AI-Enhanced Statistical Process Control (AI-SPC): Revolutionizing Quality Management in the Era of Smart Manufacturing
- General-Purpose Artificial Intelligence Models (DeepSeek, etc.) and Statistical Process Control (SPC): A New Era of Intelligent Quality Management
- Simple SPC 2.0 released, with upgraded functions and optimized performance
- Unilateral or Bilateral: An In-Depth Exploration of Specification Limits and Control Limits in SPC Analysis and Their Impact on Metrics
- How to Calculate Control Limits for Xbar-R and Xbar-S Control Charts in SPC Analysis and When to Use Each Chart
- Is SPC or Another Method Better for Determining Batch Consistency with Standards? A Recommended Analysis Approach
- Beyond SPC Control Charts: Lesser-Known but Effective Quality Analysis Tools
- SPC is the most accessible, effective, and performance-demonstrating analytical tool in the manufacturing industry.
- How to Quickly Identify Hidden Correlations Between Test Items Using the SPC System?
