- Panyu District, Guangzhou, Guangdong, China
- 2044, 2nd Floor, Yayun Avenue, Dalong Street
- whatsapp:
- +86 13265357928
SPC Blog
General-Purpose Artificial Intelligence Models (DeepSeek, etc.) and Statistical Process Control (SPC): A New Era of Intelligent Quality Management
When we talk about artificial intelligence, don't images of star models like DeepSeek come to mind? They can not only chat intelligently and write articles automatically, but also help us program efficiently. And when it comes to industrial production, we often focus on quality management tools like control charts and process capability analysis. General-purpose AI models (represented by DeepSeek, ChatGPT, Gemini, etc.) represent the cutting edge of intelligent technology in the information age, while Statistical Process Control (SPC) embodies the spirit of continuous improvement in product quality from the industrial era. Many people wonder how large models can replace SPC. Today, let's discuss what general-purpose AI models (especially models like DeepSeek) and SPC are all about. More importantly, let's explore whether we can leverage the "superpowers" of DeepSeek and other large models to upgrade traditional SPC analysis and usher in a new era of intelligent quality management!
First, we need to clarify the essence and respective focuses of general-purpose AI models and SPC. Although both are important tools and methodologies, they have significant differences in application areas and core functions. Understanding their fundamental differences and potential connections will greatly help us apply them better in practical work.
- General-Purpose AI Models (Represented by DeepSeek, etc.):
- Powerful pre-trained language models with a core focus on natural language processing and a prominent capability in code generation.
- General-purpose AI models are more commonly known as "GPT (Generative Pre-trained Transformer)," and now, DeepSeek and other emerging powerful models are even more representative.
- These models are leaders in pre-trained language models. Their core advantage lies in their ability to understand and generate natural language text, which is essentially being very good at "talking."
- This makes them incredibly effective at handling various natural language tasks, demonstrating outstanding capabilities in areas such as question answering, writing, code generation, and information summarization. For example:
- Intelligent Question Answering: Able to understand user questions and provide accurate and relevant answers, like having a "know-it-all" by your side.
- Writing Assistant: Can help users write articles, whether it's creating stories, drafting emails, or generating news reports, they can assist you, greatly improving efficiency.
- Code "Transporter" (especially models like DeepSeek, with outstanding code generation capabilities): That's right, they can also write code! Especially large models like DeepSeek excel in code generation, even assisting programmers in completing programming tasks, becoming a valuable assistant.
- Information "Speed Reader": When faced with a large amount of text information, they can quickly "scan" it, extract key points, and generate concise summaries, saving time and effort.
- SPC (Statistical Process Control):
- The cornerstone of quality management, a quality management technique that uses statistical principles and methods to monitor and control variations in the production process, ensuring stable and continuous improvement of product quality.
- Its core goal is to "keep a close eye" on variations in the production process, ensuring stable and continuous improvement of product quality.
- The core methods of SPC include control charts, process capability analysis, and various statistical analysis tools. The main techniques in this "combination punch" of SPC are:
- Control Charts: Like a "monitoring radar," they visually display fluctuations in production process data, and immediately "alarm" when "abnormal signals" are detected, reminding us to take timely measures.
- Process Capability Analysis: Like giving the production process a "physical examination," assessing its "physical fitness" and checking whether it can meet quality standards, as well as identifying areas for improvement.
- Statistical Analysis Tools: Various statistical analysis methods, such as hypothesis testing, regression analysis, etc., act like "magnifying glasses" and "microscopes," helping us deeply analyze process data and identify the "hidden culprits" affecting quality.
- The key to SPC lies in collecting, analyzing, and interpreting production process data, and taking corresponding control and improvement measures based on the analysis results. In essence, it's about using data to speak and using statistical methods to guide quality improvement. However, in today's era of data explosion and increasingly complex production environments, traditional SPC analysis methods also face some "minor challenges":
- Data analysis is somewhat "slow": Traditional SPC analysis mainly relies on manual chart viewing and analysis, which is relatively inefficient. When faced with massive real-time data, it becomes somewhat "overwhelmed."
- Too reliant on "experienced masters": How to interpret SPC analysis results and determine improvement measures largely depends on the experience and expertise of quality engineers, and there is a "shortage" of talent in this area.
- Unstructured data is "underutilized": The production process generates a lot of unstructured data, such as text records, images, and audio, but traditional SPC methods don't pay much attention to this information, which is a bit of a waste.
- Large Models (Especially DeepSeek, etc.) + SPC = "New Ways" of Intelligent Quality Management? DeepSeek and Other Large Models May Become the Key to SPC's Intelligent Upgrade
- Therefore, it's not about throwing a set of test data at a large model and having it create control charts and calculate process capabilities for you. Instead, we use SPC tools and feed the results data, such as control charts (outliers) and process capabilities, to the large model, allowing it to help us write SPC analysis reports, analyze causes, and provide suggestions.
- DeepSeek and other large models can become "super plugins" for SPC, improving the efficiency, depth, and intelligence of SPC analysis in various ways. How can DeepSeek and other large models "buff" SPC analysis?
- Root Cause Analysis and Problem Diagnosis:
- Turning unstructured data into "treasure": DeepSeek and other large models can "understand" the various unstructured data generated in the production process, such as operator text records, equipment maintenance logs, defect images, and even voice data. By analyzing this "scrap" information, DeepSeek and other large models can uncover deep-seated root causes of problems that traditional SPC methods "overlook."
- "Knowledge Graph" "Expert Embodiment" Intelligent Reasoning: DeepSeek and other large models can build a "knowledge graph" in the SPC field, "loading" knowledge such as SPC principles, process knowledge, equipment information, and historical cases. With this "knowledge base," DeepSeek and other large models can perform intelligent reasoning and diagnosis, helping quality engineers quickly locate problems and provide possible solutions for "reference."
- Predictive Quality Management and Preventive Measures:
- "Early Warning" of Quality Trends: DeepSeek and other large models can analyze historical SPC data, learn the "temperament" and "patterns" of quality fluctuations, predict future quality trends, and provide "early warnings" of potential quality problems, giving companies ample time to "prepare for a rainy day."
- "Intelligent Optimization" Suggestions for Process Parameters: Based on a "thorough understanding" of SPC data and process knowledge, DeepSeek and other large models can intelligently recommend optimal process parameter settings, making the production process more stable and improving product quality. This is much better than the traditional SPC's "after-the-fact" approach, directly "preventing problems before they occur"!
- A More "Humanized" Human-Machine Collaborative SPC Analysis Platform:
- "Do it by talking" Natural Language Interaction Interface: DeepSeek and other large models can create natural language interaction SPC analysis platforms, where users can directly issue commands in "plain language" to complete data queries, chart generation, anomaly analysis, and other operations, greatly reducing the barrier to using SPC tools and allowing more production personnel to participate in quality management.
- "Intelligent Assistant" "Expert Empowerment" Empowerment: DeepSeek and other large models can become "intelligent assistants" for quality engineers, assisting experts in complex SPC analysis work, providing "one-stop" services such as data interpretation, report generation, and solution recommendations, improving expert work efficiency and decision-making levels, and better "inheriting" expert knowledge and experience.
- Root Cause Analysis and Problem Diagnosis:
- Looking Ahead:
- The "marriage" of large models and SPC is definitely a major trend in intelligent quality management. With the increasing maturity and popularity of large model technology, we have reason to believe that large models will play an increasingly important role in SPC analysis, driving quality management from traditional models to intelligent, preventive, and efficient "fast lanes," ultimately helping companies achieve higher levels of quality excellence.
Simple SPC 2.0 released, with upgraded functions and optimized performance
With the rapid update and iteration of Simple SPC, we released Simple SPC 2.0 today. Let’s take a look at what features we have updated in 2.0!
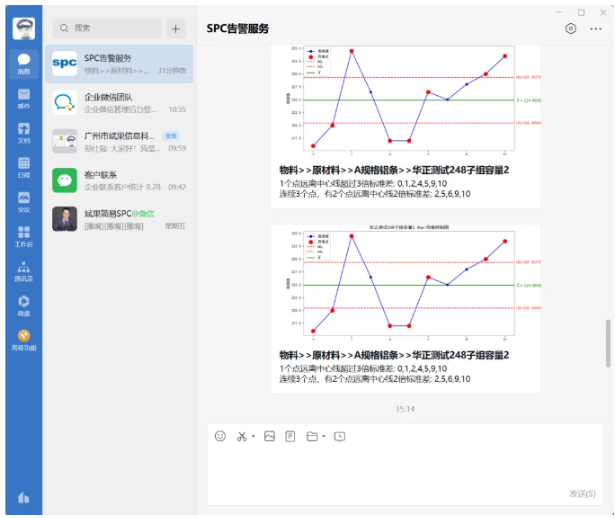
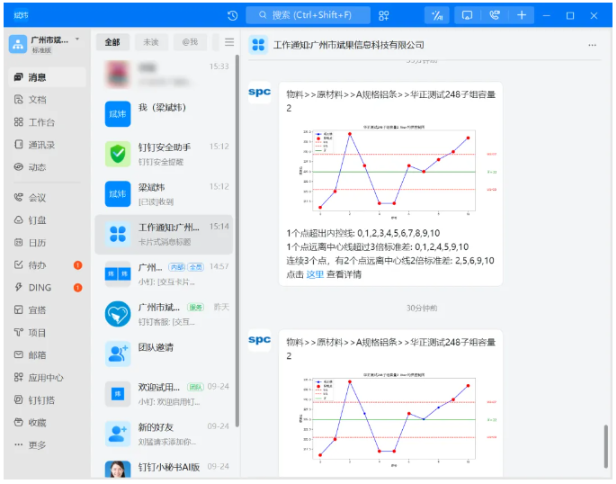
1. Push SPC abnormal alarms to WeChat and DingTalk
In the SPC system, you can configure the appKey and alarm user group of WeChat and DingTalk, and push them directly to WeChat and DingTalk. The following figure shows the actual effect of the push.
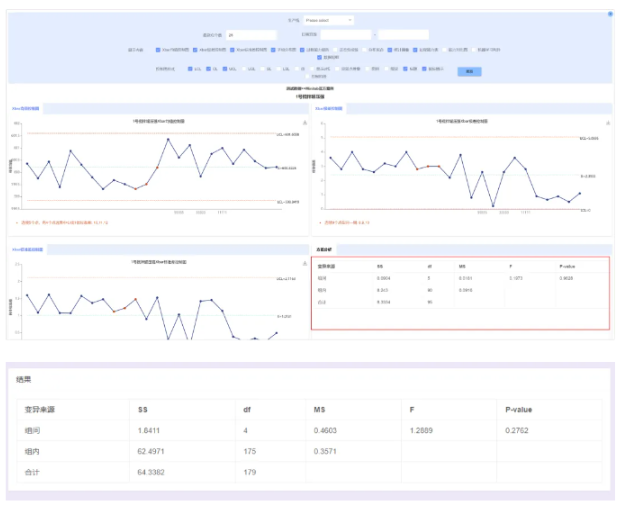
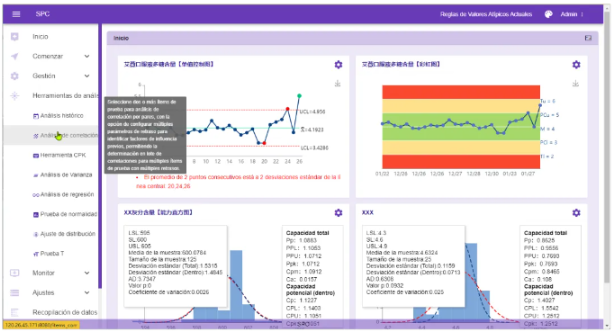
2. Integrate the variance analysis tool into the SPC analysis report
When the factor of the independent variable contains multiple levels, the statistical method of testing whether the averages of each level are equal, we have integrated the variance analysis function into the SPC analysis report, making it easier for everyone to do variance analysis.
As shown below:
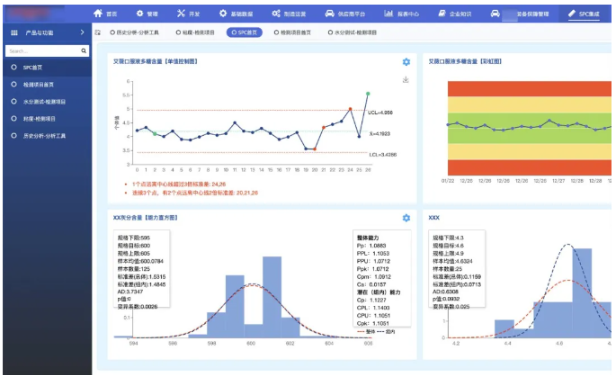
3. Add token authentication based on URL parameters to facilitate web system integration
Through something like http://xxx.com/access_token=xxxxxxxxxxm, any page of our SPC can be directly embedded through iframe. The actual effect is as follows
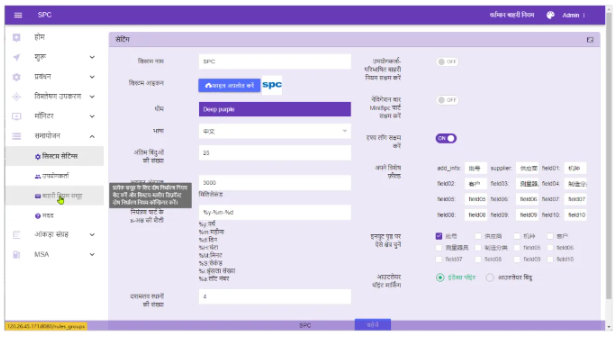
4. Added Spanish and Indian languages
Spanish
Hindi
5. Upgrade to Python 3.12, code optimization and performance improvement
The operating environment has been upgraded to the latest version of Python 3.12. At the same time, some major libraries such as sqlalchemy and pandas have also been upgraded to the latest version. During the upgrade process, some codes have been optimized, which has comprehensively improved the performance of the product.

6. Product documentation is synchronized and adapted to SPC2.0
We are serious about SPC and we are constantly innovating.
Our philosophy: extreme innovation, committed to making the best SPC products in China, and helping the quality of domestic manufacturing grow together.
CPK and PPK: Essential Questions in Quality Interviews, Do You Truly Understand Them?
In the realm of quality management, CPK (Process Capability Index) and PPK (Process Performance Index) are common interview questions and indispensable statistical indicators for quality professionals. They seem simple, yet often lead to confusion and debate.
Basic Definitions and Differences between CPK and PPK
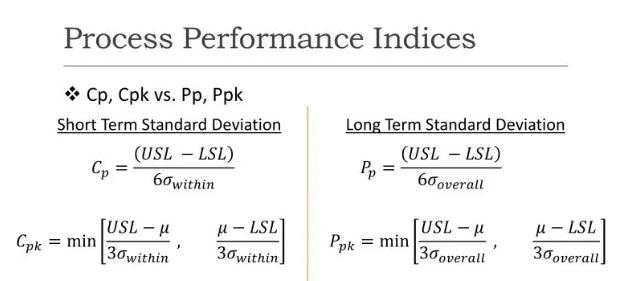
CPK: Process Capability Index, reflects the capability of a process under controlled conditions, typically used to measure short-term process capability. PPK: Process Performance Index, reflects the actual performance of a process, typically used to measure long-term process capability. The calculation formulas for both are similar, but the estimation method for σ (standard deviation) differs: CPK: Uses within-subgroup standard deviation to estimate σ; the calculation method for within-subgroup standard deviation varies for different data types. PPK: Considers overall variation and uses overall standard deviation to estimate σ. CPK might overestimate process capability, while PPK is closer to the true capability.
Application Scenarios of CPK and PPK
CPK Calculation: Based on control charts (x̄-R chart or x̄-s chart), σ is calculated using the average range (R-bar) divided by d2, or the average sample standard deviation (S-bar) divided by c4. PPK Calculation: Includes all data within the control chart in the calculation, σ is calculated directly using the STDEV() function in Excel. Cpk reflects within-subgroup variation (short-term fluctuation), while Ppk includes both short-term within-subgroup variation and long-term between-subgroup variation, representing the overall quality indicator of the entire production process. In practical applications, some advocate using Ppk for control during new product trial production and switching to Cpk for control after mass production stabilizes. This is because the quality fluctuation is large during the trial production stage, and Cpk might not be effective for control; only Ppk can provide an understanding of the overall quality.
Doubts and Reflections: Are CPK/PPK Just a "Numbers Game"?
However, some people question the value of CPK and PPK. Some believe that Ppk has limited practicality because calculating overall quality means the product has already been produced, and it's impossible to prevent defective products in real-time. Moreover, the data might not come from actual measurements but rather be "fabricated." CPK and PPK seem to have become a "numbers game." Furthermore, there's also debate about whether CPK and PPK represent short-term or long-term capability. Some point out that short-term/long-term capability has nothing to do with CPK/PPK but is solely related to sampling. Short sampling time means short-term capability, and vice versa.
How to View CPK, PPK, and Sampling?
CPK and PPK, as important process capability indicators, play a significant role in quality management. However, we should also recognize their limitations and not blindly pursue indicators while neglecting the control and improvement of the actual process. Sampling plays a crucial role in quality management. The sampling method and sample size will both affect the assessment of process capability. Therefore, when using CPK and PPK, we need to pay attention to the rationality and representativeness of sampling.
CPK, PPK, and sampling are all very important tools in quality management. We need to deeply understand their connotations and limitations and apply them flexibly to truly realize their value and achieve effective quality control.
Unilateral or Bilateral: An In-Depth Exploration of Specification Limits and Control Limits in SPC Analysis and Their Impact on Metrics
In Statistical Process Control (SPC), specification limits and control limits are two core concepts. Although they both play important roles in quality management and process monitoring, they differ in their definitions, sources, and applications. This article will explain these two concepts in detail and mainly discuss their potential to be one-sided or two-sided, as well as their impact on SPC metrics.
Specification Limits
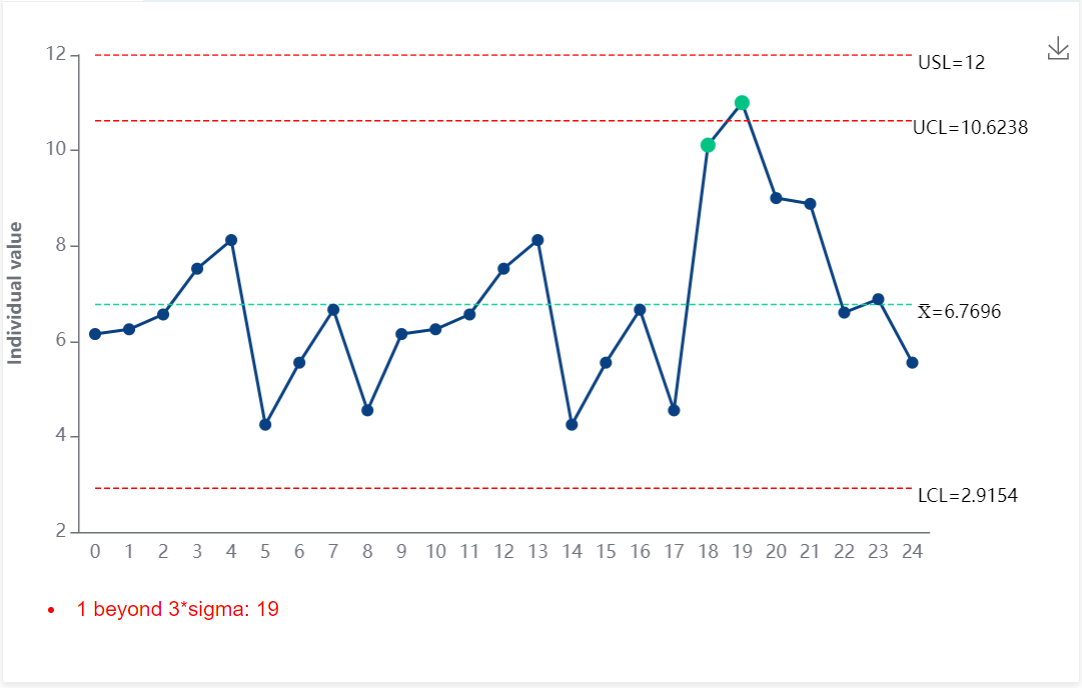
Specification limits are the acceptable range of product or process characteristics specified by customers, design specifications, or industry standards. They define the quality requirements that a product or service must meet. Specification limits typically include the Upper Specification Limit (USL) and Lower Specification Limit (LSL), used to assess whether the product meets the expected quality standards. If product characteristics exceed the specification limits, they are considered nonconforming.
Specification limits can be one-sided or two-sided:
- If the concern is only whether a characteristic value is not less than a minimum value, only the Lower Specification Limit (LSL) is set.
- If the concern is only whether a characteristic value does not exceed a maximum value, only the Upper Specification Limit (USL) is set.
Control Limits
Control limits are derived from the statistical analysis of process data and are used to monitor process stability. Control limits typically consist of the Upper Control Limit (UCL) and Lower Control Limit (LCL), reflecting the natural variation range of most data points in a process under normal conditions (normal distribution).
Control limits are usually two-sided because their primary function is to detect process stability and abnormalities. The calculation of control limits is typically based on the 6σ principle under a normal distribution, where data points within the 3σ range are considered normal process variations, and data points beyond this range are considered abnormal signals (under a normal distribution, the probability of exceeding the control limits is less than 1%).
Regardless of whether the specification limits are one-sided or two-sided, control limits are used to determine process stability and should include both upper and lower control limits to assess stability.
For example, even if the specification limit only requires the characteristic value to be greater than a minimum value (e.g., greater than 100), control limits will still be calculated based on the data (e.g., UCL = 200, LCL = 50):
The role of UCL and LCL: The Upper Control Limit (UCL) and Lower Control Limit (LCL) are used to detect abnormalities in the process. If process data points exceed these control limits, it indicates potential process anomalies that require further investigation. Even if a data point greater than 200 is acceptable based on the specification limit (as long as it is greater than 100), it may indicate process instability according to the control limit (UCL = 200), prompting further investigation into the cause of this anomaly.
Abnormality and Stability: Even if the process characteristics meet the specification limits, significant process variation (e.g., data points exceeding UCL or LCL) may indicate process instability. Control limits help identify this potential instability.
If the specification limit is one-sided (e.g., only LSL), control limits will still be two-sided. Exceeding the control limits will still trigger alarms, but data points exceeding LCL should receive particular attention, while data points exceeding UCL can be analyzed or ignored as needed.
Impact of Specification Limits and Control Limits on SPC Metrics
When the specification limit is one-sided, it affects certain SPC metrics, especially those related to capability indices such as Ca, Ppk, and Cpk.
Ca (Capability Index) measures the degree of deviation between the process mean and the specification center. For one-sided specification limits, Ca cannot be calculated due to the lack of a reference center value.
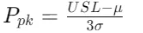
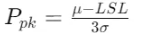
Ppk and Cpk measure process performance and capability. For one-sided specification limits, Ppk and Cpk calculations only consider the direction of the existing specification limit. For example:
- Only USL:
- Only LSL:
- Only USL:
In these cases, one-sided specification limits only assess process capability in one direction, potentially leading to an incomplete evaluation of the process. Particularly with one-sided specification limits, it is essential to use two-sided control limits to monitor process stability comprehensively.
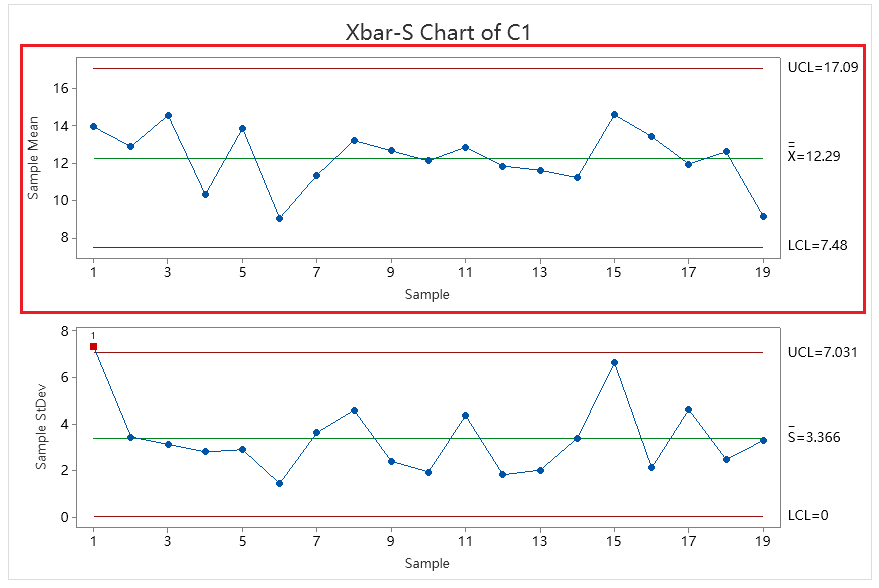
How to Calculate Control Limits for Xbar-R and Xbar-S Control Charts in SPC Analysis and When to Use Each Chart
You may have noticed that when using Minitab to create Xbar-R and Xbar-S control charts, each is composed of a pair of charts:
- Xbar-R Control Chart includes: Xbar Control Chart and R Control Chart
- Xbar-S Control Chart includes: Xbar Control Chart and S Control Chart
So the questions arise:
- For the same data source, are the Xbar Control Charts in the Xbar-R and Xbar-S Control Charts the same?
- When should we use the Xbar-R Control Chart, and when should we use the Xbar-S Control Chart?
- How are the control limits of these control charts calculated?
This article provides the most detailed explanation available on the internet.
To clarify, the Xbar Control Charts in the Xbar-R and Xbar-S Control Charts are not the same. The use of Xbar-R Control Chart and Xbar-S Control Chart is conditional; we should not use Xbar-R and Xbar-S simultaneously on the same set of inspection data. Therefore, we do not need to worry about whether the Xbar Control Charts in Xbar-R and Xbar-S are the same, because we will not be using Xbar-R and Xbar-S at the same time.
For subgroup sizes ≤10
we need to use the Xbar-R Control Chart. The control limits for the Xbar Control Chart and R Control Chart are calculated as follows:
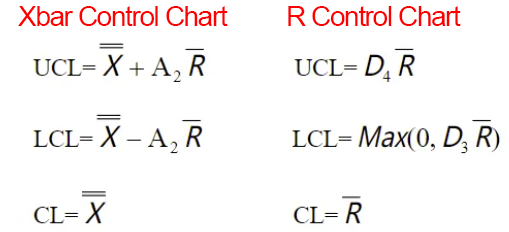
- Rbar: The average of the ranges of each subgroup
For subgroup sizes >10
we need to use the Xbar-S Control Chart. The control limits for the Xbar Control Chart and S Control Chart are calculated as follows:
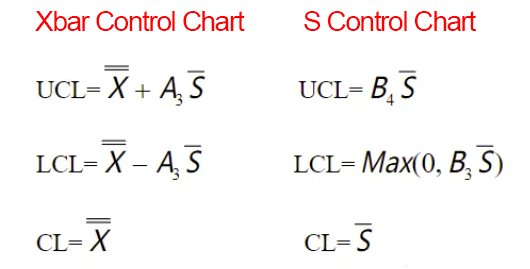
- Sbar: The average of the standard deviations of each subgroup (Note: The standard deviation should be calculated with the denominator n−1)
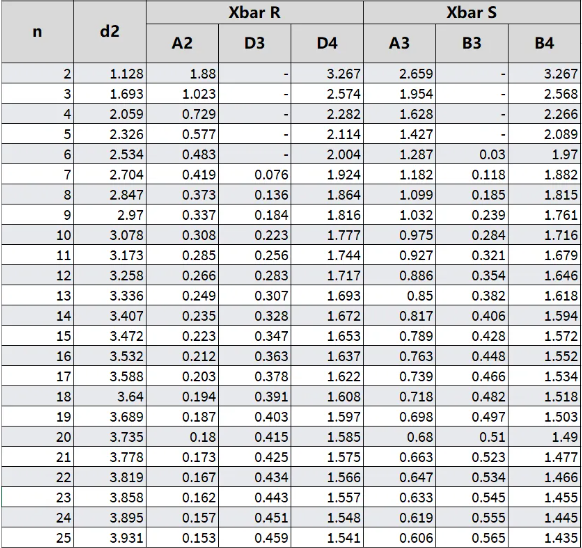
The SPC constants such as A2, D4, A3, B4, etc., used in these formulas are as follows:
- Simple SPC 4.0 – Detailed Product Overview
- Simple SPC 4.0 Official Release
- Using data to safeguard safety: Application practices of SPC in the pharmaceutical industry
- How can risks be identified in advance in automobile manufacturing? — Sharing SPC application practices
- Innovative Practices and Applications of Web SPC Systems
- Should Manufacturing Companies Still Implement SPC Amid Economic Downturn and Poor Business Performance?
- What should we do if the customer requires the immediate implementation of SPC process control during a factory audit?
- Simple SPC has been recognized for the third time as the "2025 SPC Statistical Process Control Software of the Year" by China SoftWare Home.
- Giving SPC AI Wings: DeepSeek Enhancing Efficiency and Depth of Quality Management
- AI-Enhanced Statistical Process Control (AI-SPC): Revolutionizing Quality Management in the Era of Smart Manufacturing
- General-Purpose Artificial Intelligence Models (DeepSeek, etc.) and Statistical Process Control (SPC): A New Era of Intelligent Quality Management
- Simple SPC 2.0 released, with upgraded functions and optimized performance
- CPK and PPK: Essential Questions in Quality Interviews, Do You Truly Understand Them?
- Unilateral or Bilateral: An In-Depth Exploration of Specification Limits and Control Limits in SPC Analysis and Their Impact on Metrics
- How to Calculate Control Limits for Xbar-R and Xbar-S Control Charts in SPC Analysis and When to Use Each Chart
- Is SPC or Another Method Better for Determining Batch Consistency with Standards? A Recommended Analysis Approach
- Beyond SPC Control Charts: Lesser-Known but Effective Quality Analysis Tools
- SPC is the most accessible, effective, and performance-demonstrating analytical tool in the manufacturing industry.
- How to Quickly Identify Hidden Correlations Between Test Items Using the SPC System?