- Panyu District, Guangzhou, Guangdong, China
- 2044, 2nd Floor, Yayun Avenue, Dalong Street
- whatsapp:
- +86 13265357928
What types of charts can be used in dashboards for subgroup-based inspection items?
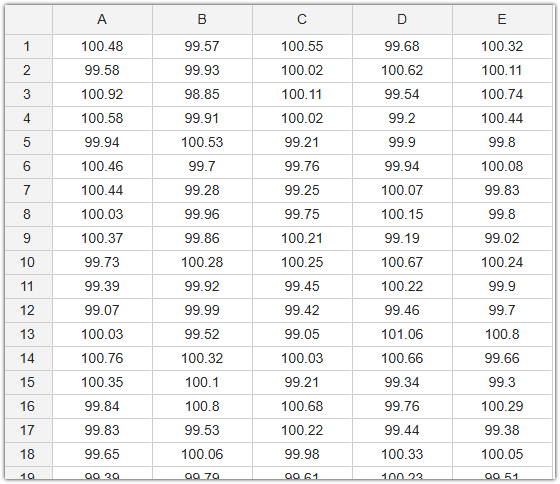
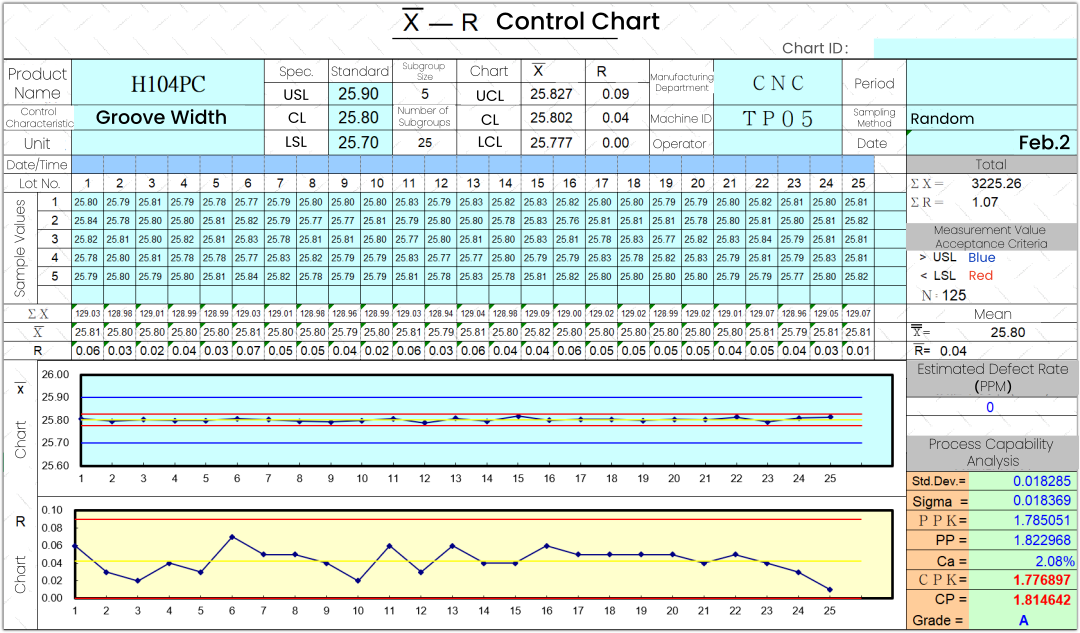
In SPC analysis, many inspection datasets are collected in subgroups.
For this type of data, how should SPC dashboards be designed for a single inspection item?
For subgroup-based inspection items, we provide six standard SPC dashboard charts.
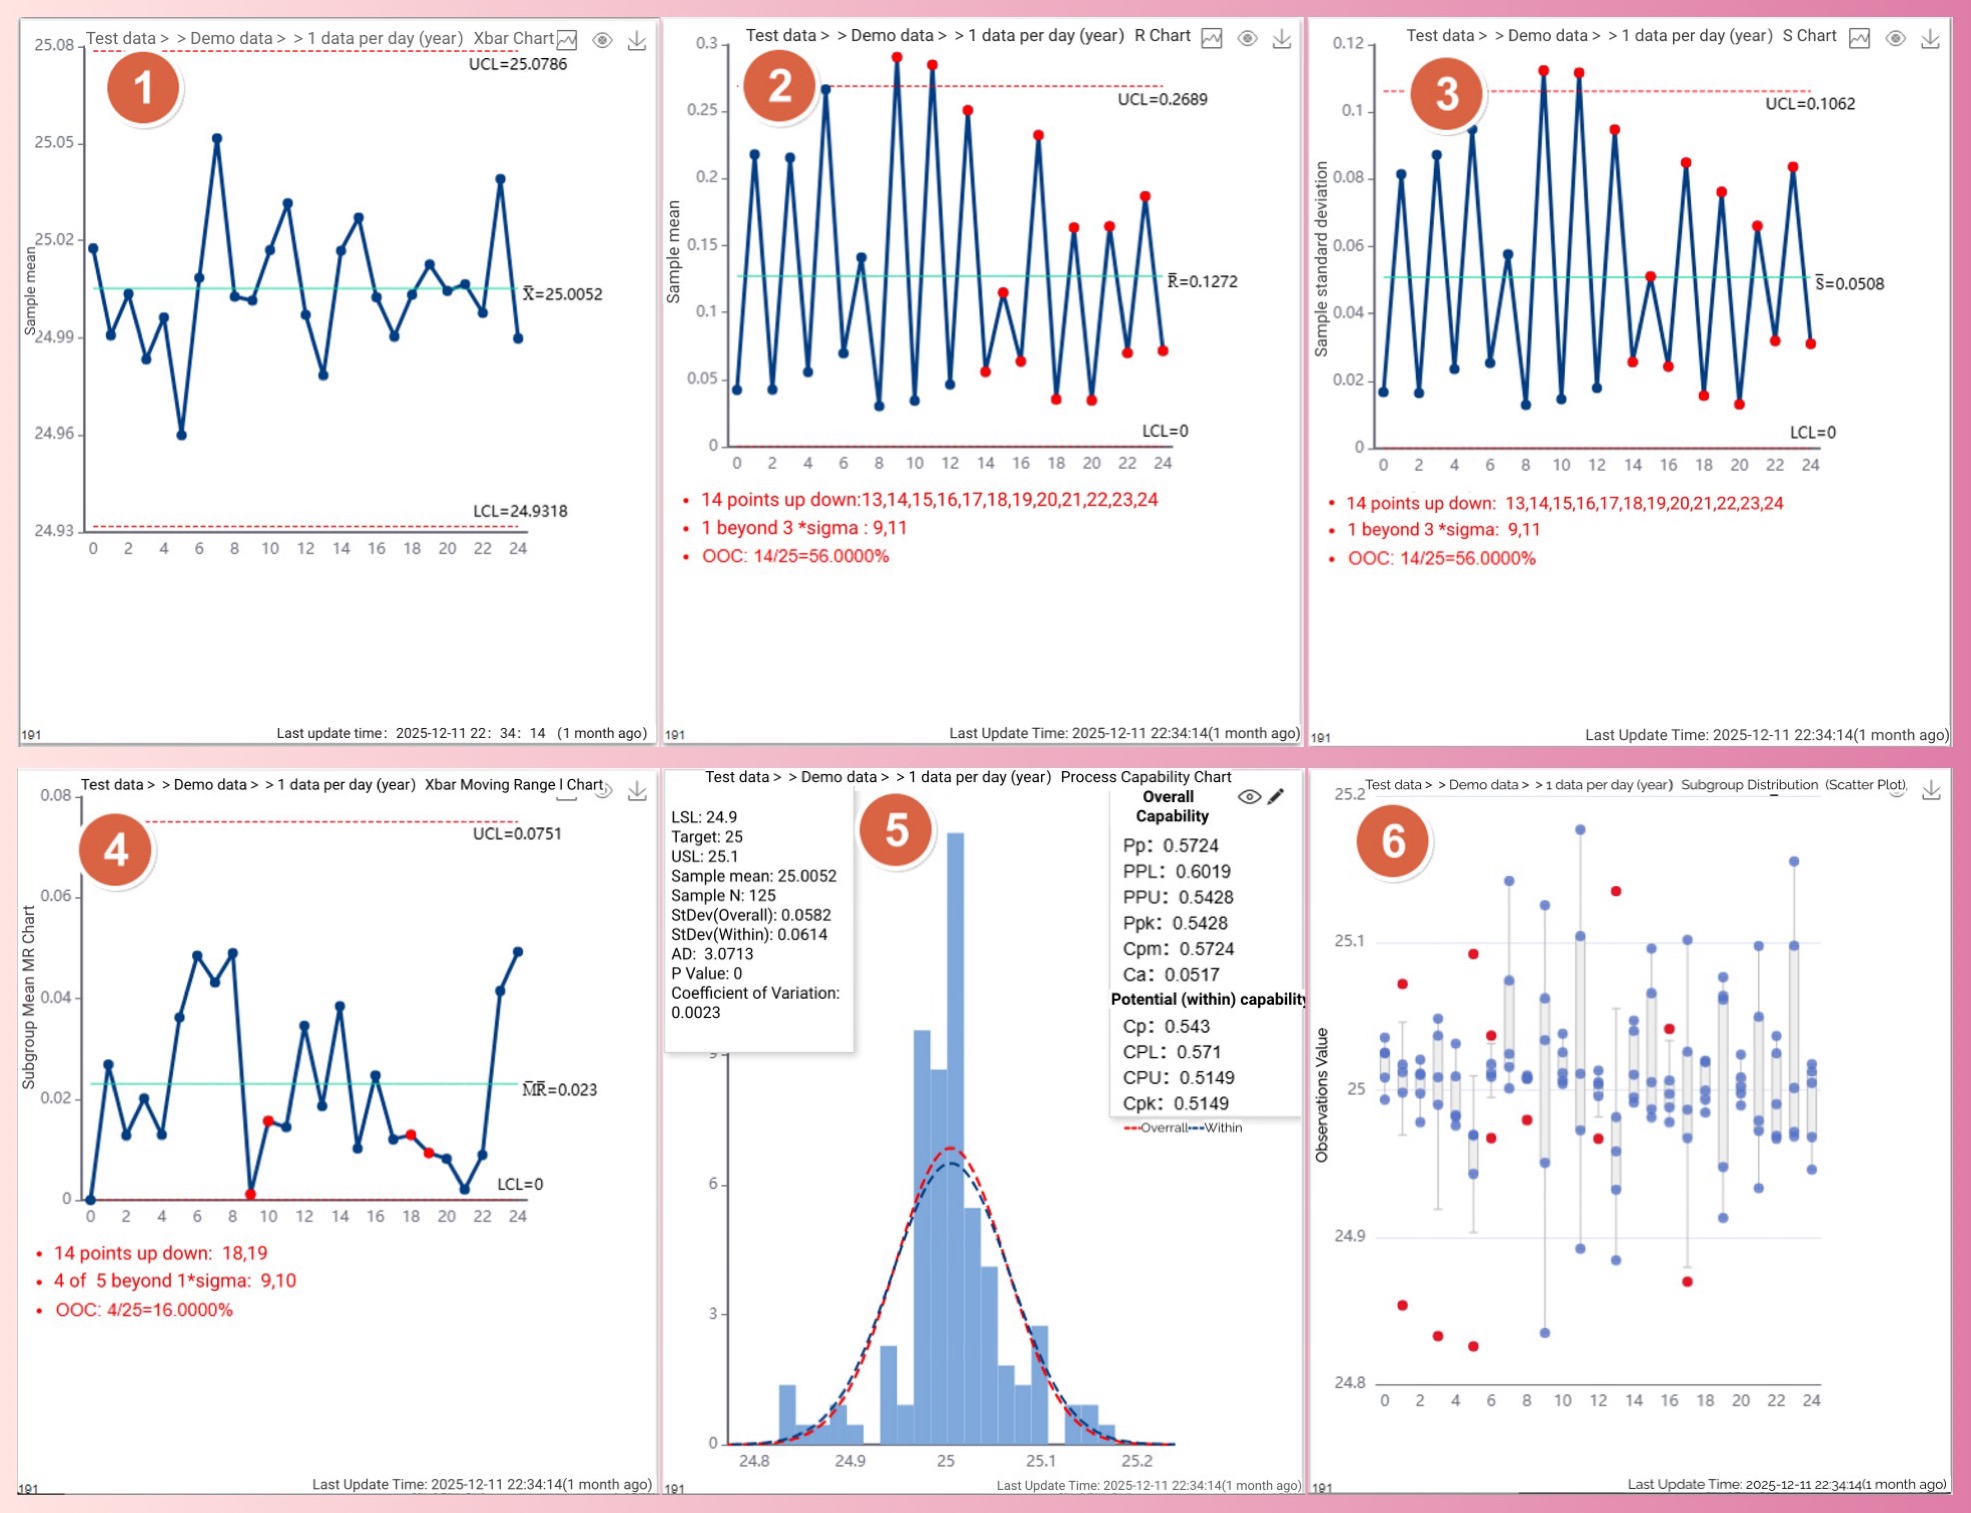
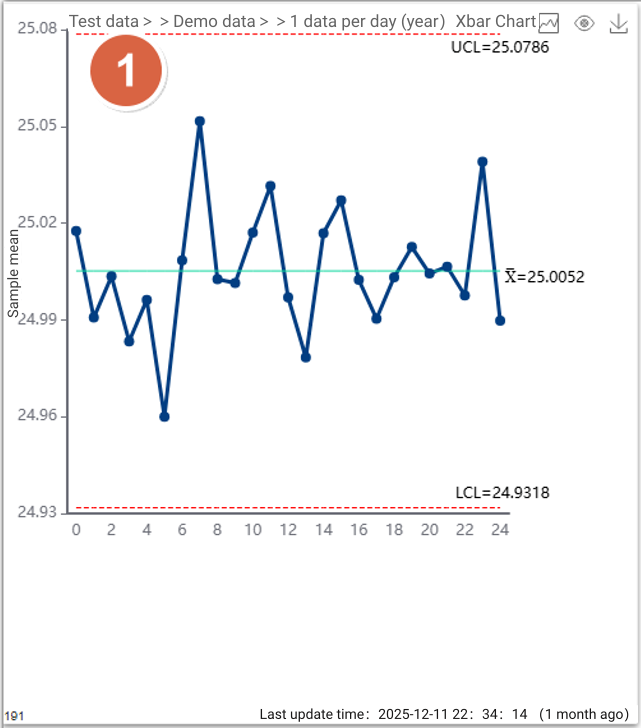
P1:Xbar Control Chart
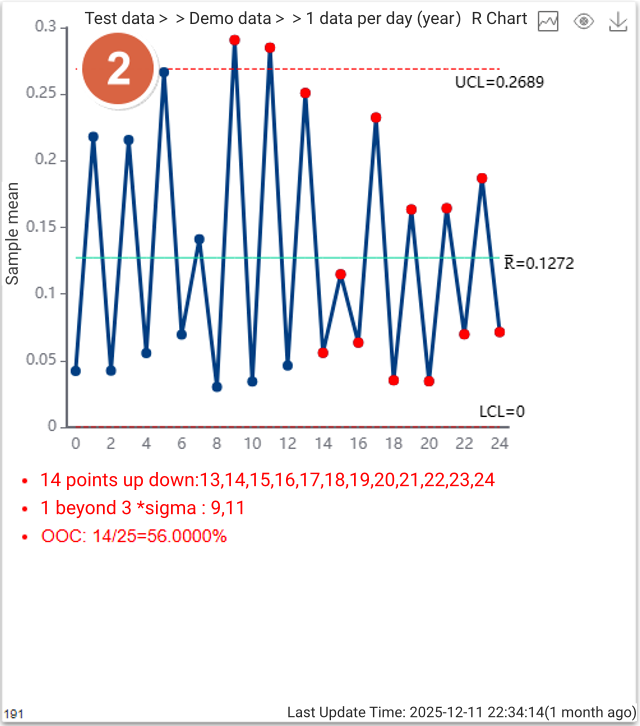
P2:R Control Chart
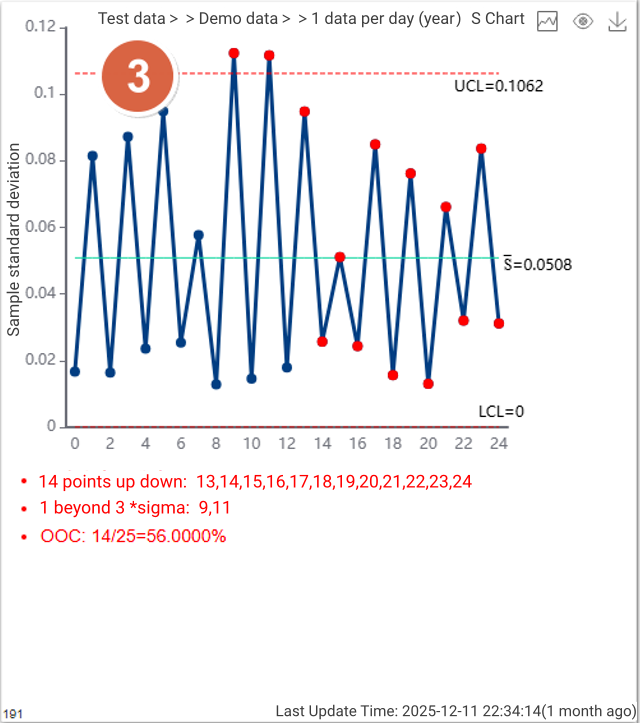
P3:S Control Chart
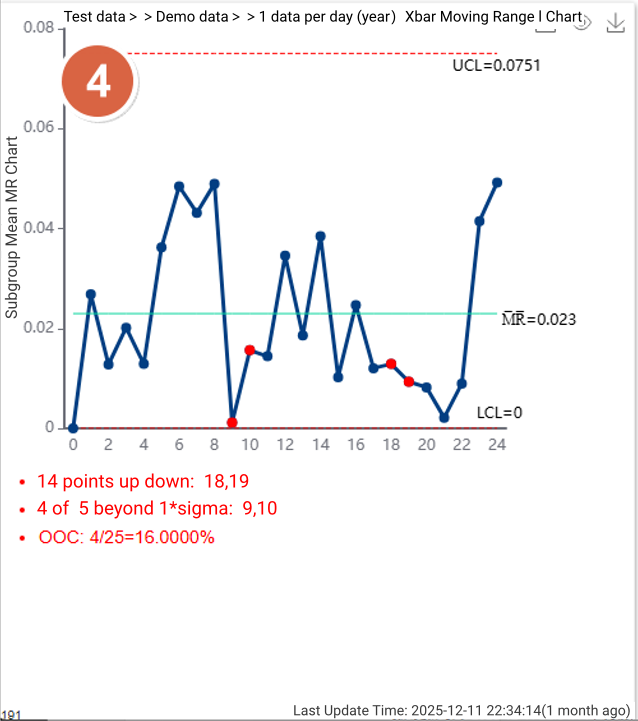
P4:Xbar Moving Range Control Chart
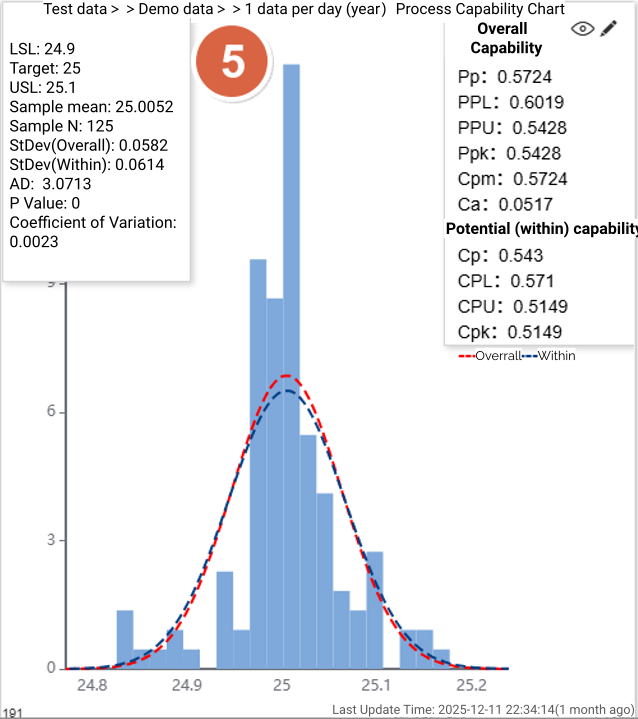
P5:Process Capability Chart
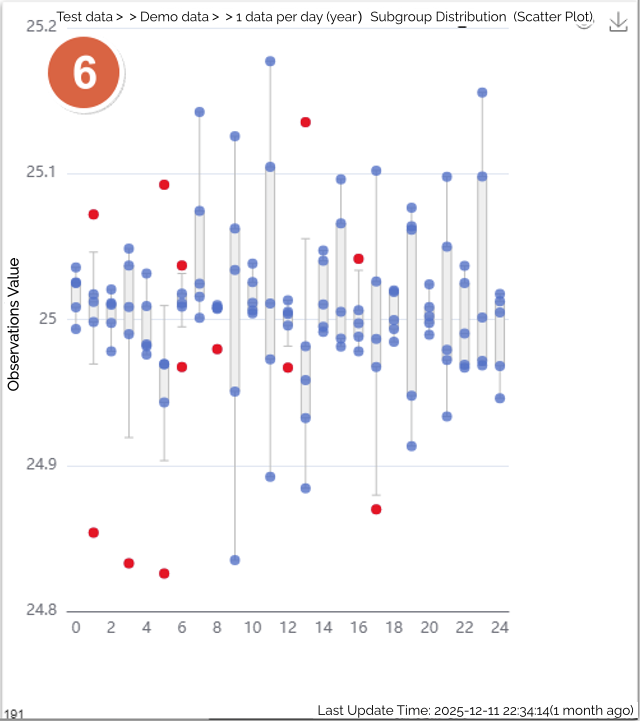
P6:Subgroup Distribution Chart (Scatter Plot)
In the SPC dashboard shown above:
You can display multiple charts for the same inspection item, or
You can display different charts for different inspection items,
depending on your monitoring and analysis requirements.
- An In-Depth Analysis of SPC Abnormality Detection Logic
- What creative uses can be made for dashboards containing single-value test data?
- What If Subgroup Sizes Are Not Fixed?
- Invisible Variations That Define Yield :Practical Applications of SPC in Semiconductor Manufacturing
- Simple SPC 4.0 – Detailed Product Overview
- Simple SPC 4.0 Official Release
- Using data to safeguard safety: Application practices of SPC in the pharmaceutical industry
- How can risks be identified in advance in automobile manufacturing? — Sharing SPC application practices
- Innovative Practices and Applications of Web SPC Systems
- Should Manufacturing Companies Still Implement SPC Amid Economic Downturn and Poor Business Performance?
- What should we do if the customer requires the immediate implementation of SPC process control during a factory audit?
- Simple SPC has been recognized for the third time as the "2025 SPC Statistical Process Control Software of the Year" by China SoftWare Home.
- Giving SPC AI Wings: DeepSeek Enhancing Efficiency and Depth of Quality Management
- AI-Enhanced Statistical Process Control (AI-SPC): Revolutionizing Quality Management in the Era of Smart Manufacturing
- General-Purpose Artificial Intelligence Models (DeepSeek, etc.) and Statistical Process Control (SPC): A New Era of Intelligent Quality Management
- Simple SPC 2.0 released, with upgraded functions and optimized performance
- CPK and PPK: Essential Questions in Quality Interviews, Do You Truly Understand Them?
- Unilateral or Bilateral: An In-Depth Exploration of Specification Limits and Control Limits in SPC Analysis and Their Impact on Metrics
- How to Calculate Control Limits for Xbar-R and Xbar-S Control Charts in SPC Analysis and When to Use Each Chart
- Is SPC or Another Method Better for Determining Batch Consistency with Standards? A Recommended Analysis Approach
- Beyond SPC Control Charts: Lesser-Known but Effective Quality Analysis Tools
- SPC is the most accessible, effective, and performance-demonstrating analytical tool in the manufacturing industry.
- How to Quickly Identify Hidden Correlations Between Test Items Using the SPC System?